If you're experiencing issues such as MariaDB/Apache/SSH or other services crashing and not restarting after the failure, and require time to investigate the issue, Monit is perhaps the best way to monitor and restart services in case they fail. This guide is to walk you through the process of installing and configuring Monit on CentOS 7 / RHEL 7.
INSTALL MONIT
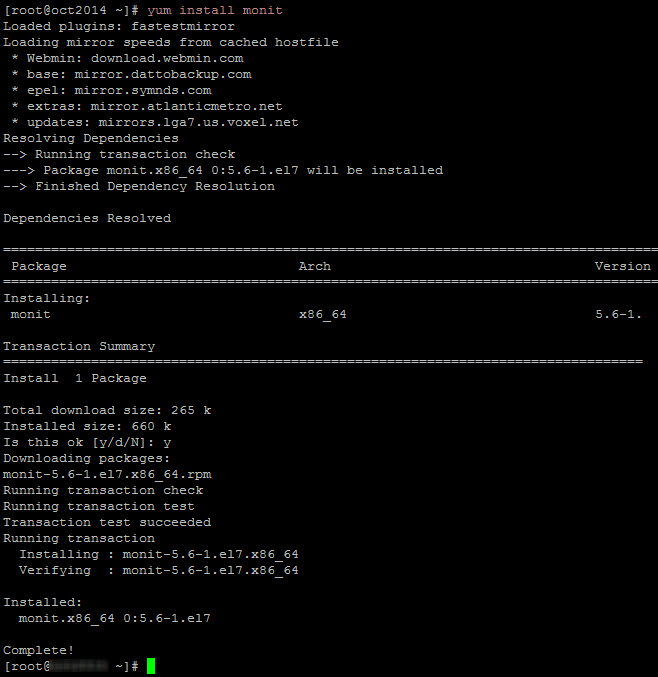
Use YUM package manager:
yum install monit
Note: if the command above fails, make sure you've enabled epel repository in your system
Output should look like this:
ENABLE MONIT WEB INTERFACE
Open Monit configuration file to setup web interface:
vi /etc/monitrc
Locate following code and comment it out:
set httpd port 2812 and
use address localhost  # only accept connection from localhost
allow localhost        # allow localhost to connect to the server and
allow admin:monit      # require user 'admin' with password 'monit'
allow @monit           # allow users of group 'monit' to connect (rw)
allow @users readonly  # allow users of group 'users' to connect readonly
Right below add:
set httpd port 2812
allow 0.0.0.0/0.0.0.0
allow admin:monit
It should look like this:
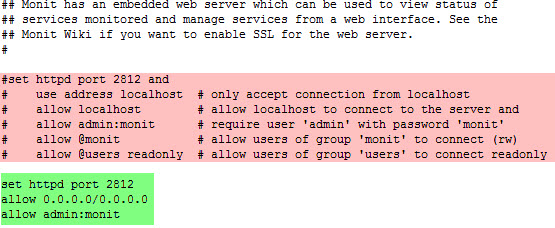
Save the changes.
START MONIT SERVICE
Execute following command:
service monit start
or this one:
systemctl restart monit.service
To auto start Monit after reboot (on start-up), run following command:
systemctl enable monit.service
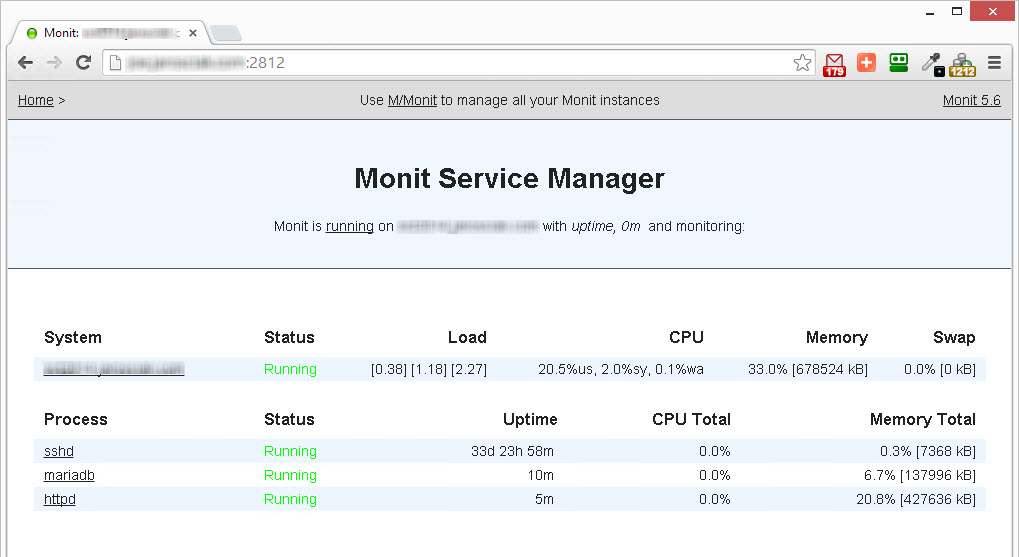
You should now be able to can access the Monit web interface by using http://your-ip-address:2812. To do so, use the username 'admin' and password 'monit' (configured earlier).
If the page doesn’t load, it’s possible your CentOS 7 / RHEL 7 system has enabled FirewallD and you need to create an exception for port 2812. To do so, execute following command:
firewall-cmd --add-port=2812/tcp --permanent
Note: remove --permanent if you want this only as a temporary firewall change (removed on reboot)
In order to apply the firewall rule, you'd need to restart the firewall service first:
systemctl restart firewalld
You should now be able to access Monit web interface.
MONIT SERVICE MONITORING AND CONFIGURATION
Now that the web interface is working, we can configure Monit by placing service configuration files into /etc/monit.d/ directory.
I'll explain the process on MariaDB service monitoring.
-
Navigate to etc/monit.d/ and create a new file called 'mariadbmonitor'
-
Enter following content into above newly created file:
check process mariadb with pidfile /var/run/mariadb/mariadb.pid
start program  "/usr/bin/systemctl start mariadb.service"
stop program  "/usr/bin/systemctl stop mariadb.service"
-
Save the 'mariadbmonitor’ file
-
Run following command for Monit change to take effect:
monit reload
-
Wait for 30 seconds and reload Monit web interface at http://your-ip-address:2812, you'll now see that Monit is actively monitoring your MariaDB service
-
To test the change. Manually stop your MariaDB service using following command:
systemctl stop mariadb.service
- Wait for 30 seconds and if you see that Monit has automatically started MariaDB again, you've successfully completed installation and configuration of Monit on your CentOS 7 / RHEL 7 system.
MONIT CONFIGURATION FOR APACHE & SSH
To monitor Apache, navigate to etc/monit.d/ and create a new file called 'apachemonitor' with following content:
check process httpd with pidfile /var/run/httpd/httpd.pid
start program  "/usr/bin/systemctl start httpd.service"
stop program  "/usr/bin/systemctl stop httpd.service"
To monitor SSH, navigate to etc/monit.d/ and create a new file called 'sshdmonitor' with following content:
check process sshd with pidfile /var/run/sshd.pid
start program  "/usr/bin/systemctl start sshd.service"
stop program  "/usr/bin/systemctl stop sshd.service"
--
Now that Monit is successfully installed and configured to monitor Apache, MariaDB & SSH, you can visit Monit web interface at http://your-ip-address:2812, it should look like this:
You can also get the output from the command line by using following commands:
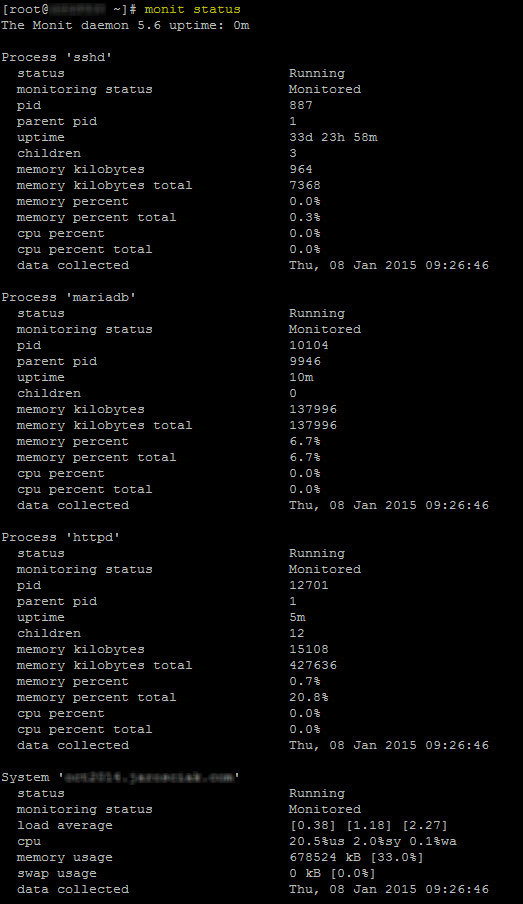
To see the status use:
monit status
Output should look like this:
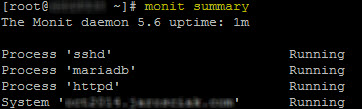
To access a simplified summary page and confirm that processes are being monitored:
Use command:
monit summary
Output will look something like this: